Sample Data and Analysis Discussion
Below is test data from a generator taken while the generator was at no load (open circuit condition). Note the air-gap flux density waveform passes through zero at the quadrature axis (90 degrees from the pole axis). The flux density waveform can be obtained by integrating the flux probe waveform. In the following displays the flux density waveform has been inverted to minimize overriding the pertinent search coil data (slot data preceding the poles).
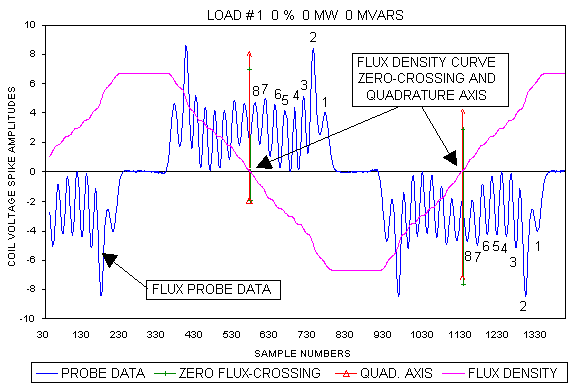
Figure 3: Open Circuit (No-Load) Data
==========================================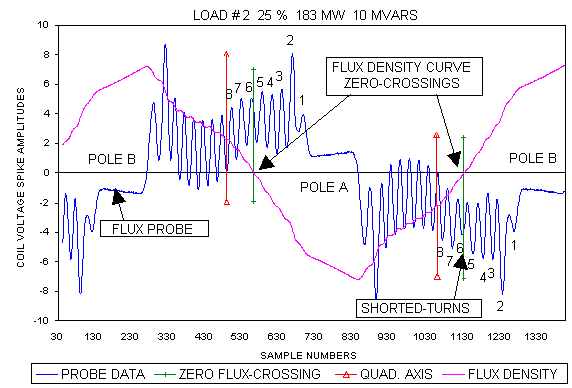
Figure4: Low/Intermediate Load with Shorted Turn Pole B-Coil 6
==========================================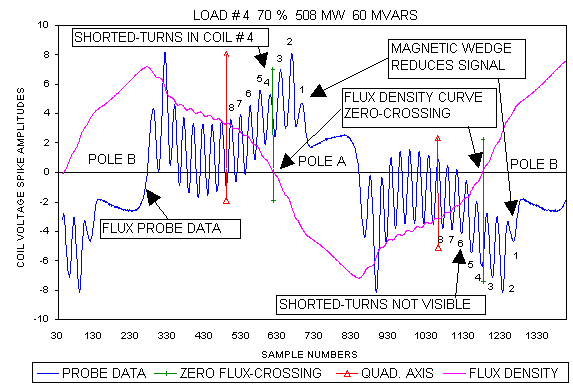
Figure 5: High/Intermediate Load with Shorted Turns Pole A-Coil 4
==========================================Test and analyses of waveforms when the generator is under load, show that the distortion factors, mentioned above, are minimal where the air-gap flux density crosses through zero (zero crossing). It has been shown that the zero crossing traverses from the quadrature axis towards the #1 coil slots leading the poles as load is increased.
All figures above show test data from the same unit. Note that the zero-crossings shift from the quadrature axis to near the 6th and 4th coil slots, respectively.
This phenomenon is due to power angle shifts with load. Thus, by taking between 5 and 10 sets of test data (depending on the unit's number of coils) from zero load to full load at unity power factor, excellent shorted-turn detection sensitivity can be obtained at all the coil slots preceding the poles.
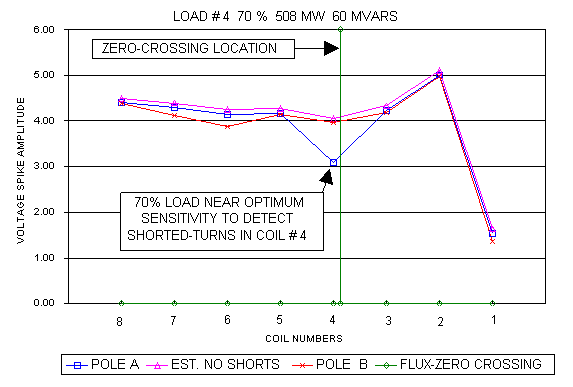
This machine suffers shorted-turns in coil # 6 on one pole and coil #4 on the other pole. As can be seen in the figures, these shorted turns are defined best at the loads where the air-gap flux density zero-crossing is aligned with these slots.
Test data recorded using a 32 bit "Y" axis resolution (65,536 points) analog to digital (A/D) computer board can produce very descriptive and quantitative data reductions. Using digital data, a computer program can invert the slot voltage spikes "Y" values of one pole and align them with the data from the other pole for a direct comparison.
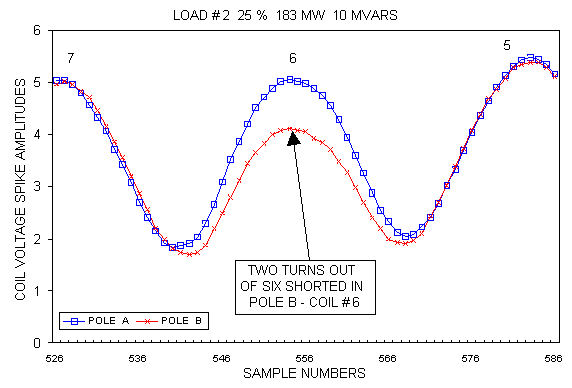
The three figures below are examples of computer analysis displays of a generator at a low intermediate load approximately 25%. With this data in digital form, the computer can calculate voltage spike amplitudes and/or areas for use to estimate the number of shorted turns in the effected coil.
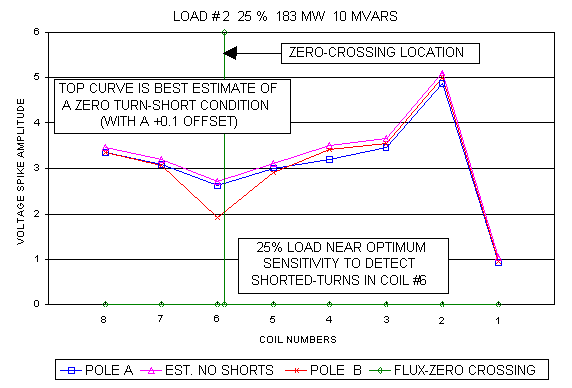
Two turn shorts out of six turns in coil #6 pole B were identified at this load. Without distortion effects, two turn shorts equate to a 33.3% smaller voltage spike. The actual test data produced a 26% and 30% reduction using voltage spike amplitudes and area ratios, respectively. Partial shorted turns can not exist; therefore, engineering judgement suggests that there are two shorted turns.
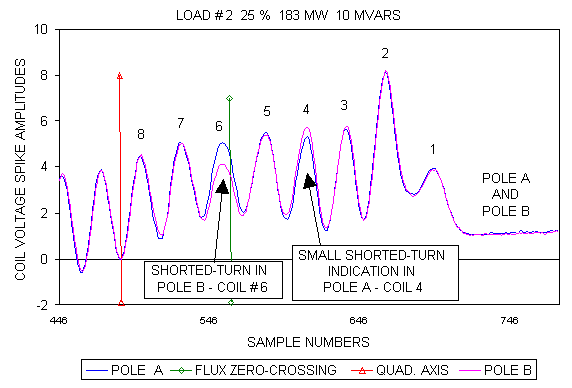
Lead Slots Data Comparison
==========================================
Magnified Lead Slots Data Comparison
==========================================
Signature Analysis (25% Load)
==========================================The figures below are graphs of quantitative voltage spike amplitudes of all the coils for the generator loads in the above figures respectively. These type graphs for each load are signatures of the winding condition when the data were taken.
New test data, taken at the same loads, can be compared to this data to improve the overall sensitivity for detecting shorted turns. For example, if both pole A and B coils #6 had an identical number of shorted turns (2) during a retest, these original graphs would help identify the condition.
Signature Analysis (70% Load)
- GENERATORTECH, INC.
- Support@Generatortech.com
- Phone: 518.399.4646
- Fax: 518.399.7562
- 104 Newman Rd
- Schenectady, NY USA 12302-9517
© 2017 Generatortech, Inc.